

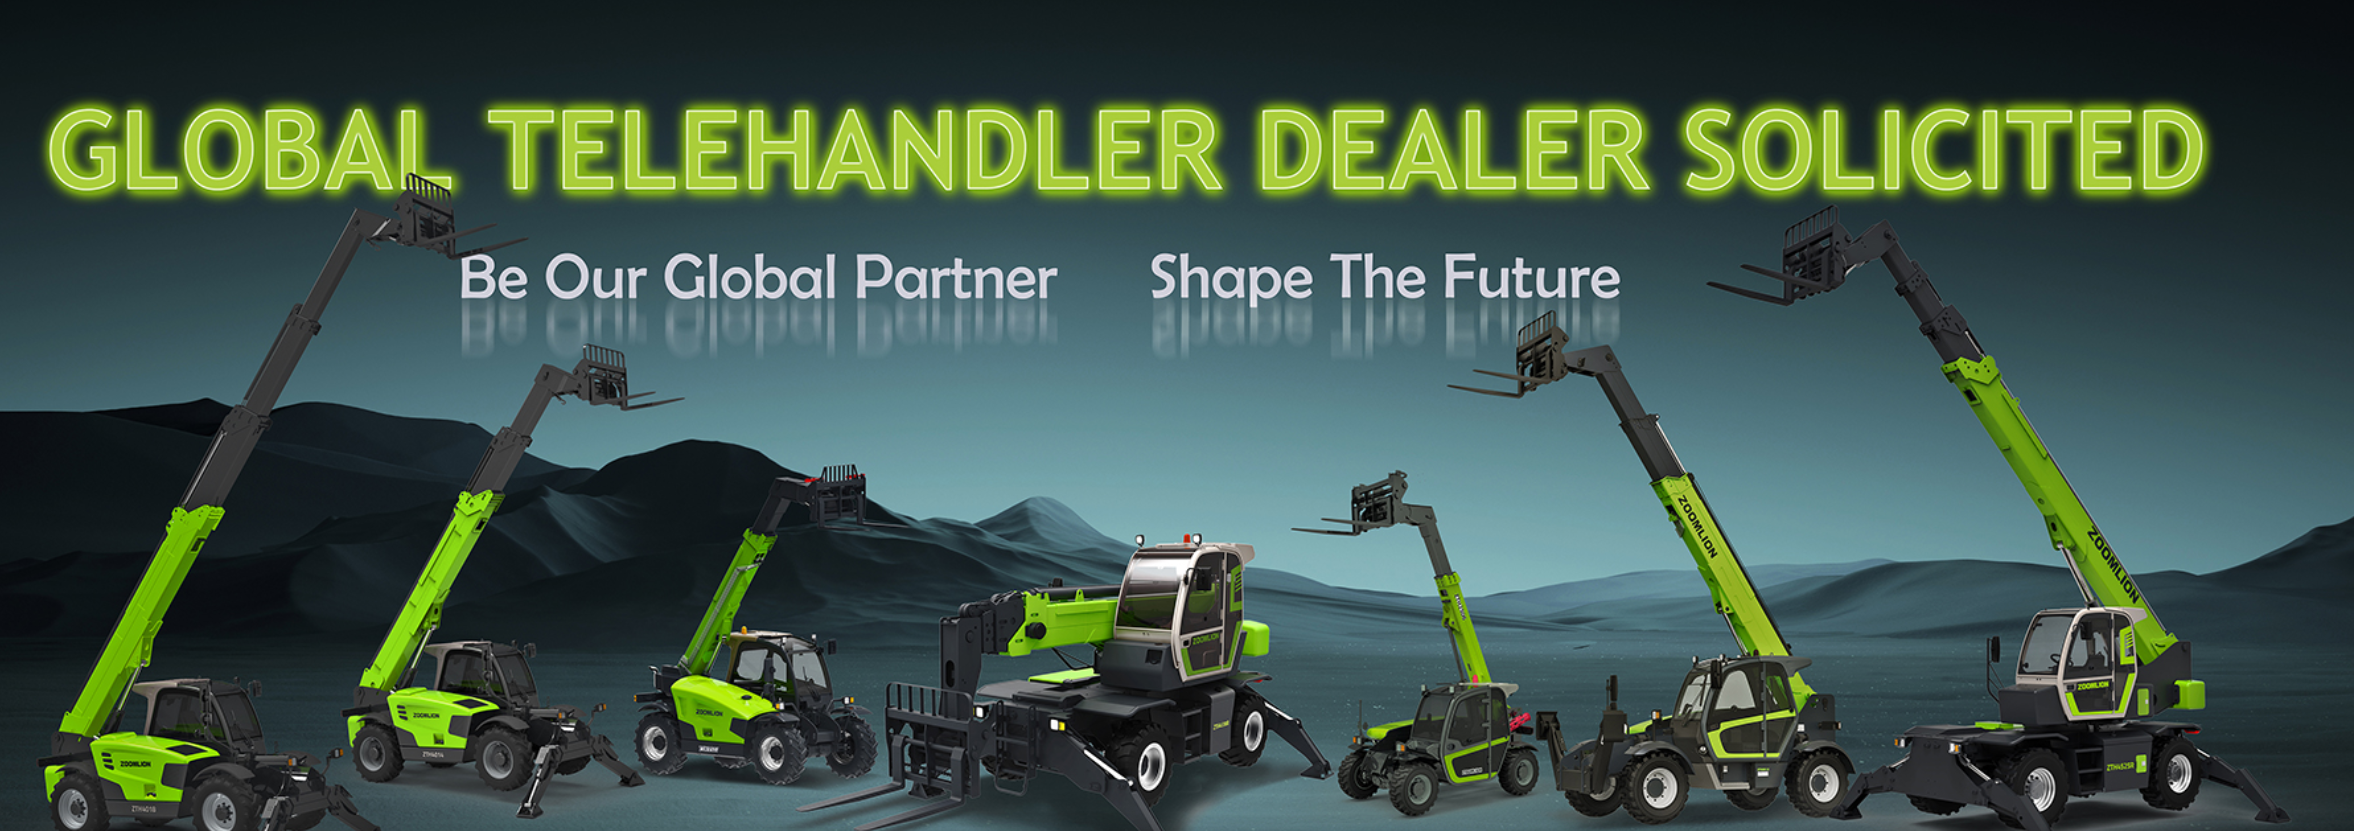
Why a comparative approach saves you money from day one
Start with a clear split: lifecycle value versus total cost of ownership. When you stack components side by side you spot hidden drains—downtime, parts delivery, and operator retraining—that simple sticker-price comparisons miss. Right away, check comparable platforms and related machines like an off road telehandler and how dealers present service networks; those signals predict real uptime. FAO reports on mechanization trends in Southeast Asia provide the macro backdrop for demand and resale expectations, which matters if you expect to sell or trade a unit later. If you’re shopping, also scan listings for agricultural telehandler for sale to compare how manufacturers package warranties and service plans across product lines.
Breakdown: what to compare, line by line
Compare these categories consistently for each machine you evaluate. Treat every line item as a decision point.
– Acquisition price: base machine cost plus mandatory add-ons. – Warranty and service plan: length, what’s covered, and response time. – Parts availability: local stocking versus ship-from-factory lead times. – Fuel or energy use: expected hours per day and duty cycle. – Operator training and safety compliance: time and cost to certify crews. – Scheduled maintenance: interval, task complexity, and labor rates. – Downtime cost: lost production per hour multiplied by realistic downtime. – Resale value: market appetite and historical depreciation for the brand.
How to convert lifecycle value into numbers
Turn lifecycle factors into comparable metrics. Use cost-per-operating-hour and uptime percentage as primary KPIs. Estimate expected operating hours per year, then calculate: total lifecycle cost = acquisition + (annual operating cost × years) + maintenance + parts + downtime losses − expected resale. Divide by total operating hours to get cost-per-hour. Compare that to projected income or productivity per hour. This makes the trade-offs tangible: a higher upfront price can be justified if it lowers cost-per-hour through better uptime or cheaper parts.
Quick practical comparisons you can run today
Run two fast checks for each candidate machine:
– Best-case routine: assume ideal service, normal fuel use, and scheduled maintenance on time. What’s cost-per-hour? – Realistic-case routine: add 10–20% to downtime and parts delay based on local supply realities. Which machine’s cost jumps the least?
These two scenarios reveal which models are brittle under supply-chain stress and which hold value during long seasons. Keep your assumptions consistent across brands: same operating hours, same local labor rate, same resale horizon.
Common mistakes that skew comparisons
Avoid these traps that derail honest comparisons:
– Comparing different duty cycles: a lift rated for light intermittent use won’t match a heavy-duty machine under continuous load. – Ignoring the cost of training and certifications, especially for articulating booms with complex controls. – Treating warranty length as equal coverage—check exclusions for wear parts and electronics. – Basing resale expectations on limited local data; use regional trends like those reported by reputable institutions.
Alternatives and short evaluations
When an articulating boom lift seems overkill, consider these options and their trade-offs:
– Telescopic boom: better reach-for-reach jobs but usually higher initial cost and different maintenance profile. – Scissor lift: cheaper for vertical work with less complexity, but unsuitable for outreach tasks. – Telehandler: versatile on mixed sites—matchable to tasks in construction and agriculture; if you need to compare, look for models with documented service networks and parts availability.
Each alternative lowers certain costs but raises others. Map tasks to machine strengths before favoring lower upfront cost.
Checklist for final selection
Before you sign, confirm these items directly with the dealer or service partner:
– Local service response time in writing. – Parts lead-time guarantees or local stock confirmation. – Clear definition of warranty exclusions. – Training package and estimated downtime for crew certification. – Realistic resale estimate or trade-in program details.
Bringing the comparison home
Use the cost-per-hour metric and the realistic-case scenario to rank machines. The best choice balances low operational surprises with acceptable upfront spend. When those rankings point toward a brand that offers reliable parts, transparent service terms, and predictable resale behavior, you get a dependable lifecycle value rather than a cheap short-term bargain. That combination is what you should look for from a supplier like Zoomlion Access when you want straightforward performance without guesswork.